Recently, a BJP Member of Parliament, Yogi Adityanath, made a claim that Western Uttar Pradesh has become unsafe on account of a demographic challenge posed to Hindus from the Muslim community.
While I can't assess the 'safety' aspect alluded to by him in his claim, I can, for my part, easily verify if there is indeed a demographic shift happening in Western Uttar Pradesh.
For this exercise, I am relying solely on the findings of Census of India, 2011. This should, in my opinion, be the most reliable source of information related to population even with the inefficiencies of a typical Government setup factored in.
We are going to make use of three elements of analysis:
- Overall population split along religions
- Overall population split along religions and across various age groups
- Population pyramids comparing distribution of population of Hindus across various age groups to that of the Muslims
The analysis will be based on the following assumptions:
- Given the same growth stages (or, socio-economic conditions), the population of Hindus and Muslims should maintain more or less the same proportion across all age groups
- Given the same growth stage (or, socio-economic conditions), the population pyramids of both Hindus and Muslims should be identical
- Any deviation from the above two scenarios indicates a difference in socio-economic conditions, or a difference in birth-rates. It is the latter condition that indicates a demographic shift
The following districts were part of Western Uttar Pradesh in 2011. Some new districts were carved out of some of these districts in 2011 and later, but since the Census activity was done before the creation of these new districts, we will work with the older list.


- Saharanpur
- Muzaffarnagar
- Bijnor
- Moradabad
- Rampur
- Amroha (earlier Jyotiba Phule Nagar)
- Meerut
- Baghpat
- Ghaziabad
- Gautam Buddha Nagar
- Bulandshahr
- Aligarh
- Hathras (earlier Mahamaya Nagar)
- Mathura
- Agra
- Firozabad
- Mainpuri
- Budaun
- Bareilly
- Pilibhit
- Shahjahanpur
- Etah
- Kasganj (earlier Kanshiram Nagar)
Population Splits
I have sorted the districts according to the the proportion of Hindus in the population and categorized the districts into three groups - where Hindus make up 70% or less of the population, where Hindus make up 70% to 85% of the population, and where Hindus make up more than 85% of the population.

This choice of the population limits for this categorization is entirely arbitrary, and is based on intuition more than anything else. It is my belief that the honourable Member of Parliament's focus is largely on the districts that are highlighted in Yellow. It is therefore based on this belief that the rest of my analysis will be limited to only these nine districts.
District Rampur


In the above two graphs, one can observe that


District Bijnor


The graphs for Bijnor are very similar to those of Moradabad. Not just we see a higher birth rate for Muslims, the population pyramids are also identical, albeit with a marginally higher growth for Muslims, leading to the conclusion that the proportion of Hindus in the population will likely gradually fall and may drop below 50% over the next four decades.
Demographic shift: Likely.
District Saharanpur


Saharanpur presents an interesting case.


District
|
Hindus
|
Muslims
|
Sikhs
|
Christians
|
Jains
|
Buddhists
|
Others
|
Rampur
|
46.0%
|
50.6%
|
2.8%
|
0.4%
|
0.1%
|
0.0%
|
0.0%
|
Moradabad
|
52.1%
|
47.1%
|
0.2%
|
0.3%
|
0.1%
|
0.0%
|
0.0%
|
Bijnor
|
55.2%
|
43.0%
|
1.4%
|
0.2%
|
0.1%
|
0.0%
|
0.0%
|
Saharanpur
|
56.7%
|
41.9%
|
0.5%
|
0.2%
|
0.3%
|
0.1%
|
0.0%
|
Muzaffarnagar
|
57.5%
|
41.3%
|
0.4%
|
0.2%
|
0.4%
|
0.0%
|
0.0%
|
Amroha
|
58.4%
|
40.8%
|
0.3%
|
0.3%
|
0.0%
|
0.0%
|
0.0%
|
Meerut
|
63.4%
|
34.4%
|
0.7%
|
0.3%
|
0.5%
|
0.1%
|
0.0%
|
Bareilly
|
63.6%
|
34.5%
|
0.6%
|
0.3%
|
0.0%
|
0.1%
|
0.0%
|
Baghpat
|
70.4%
|
28.0%
|
0.0%
|
0.1%
|
1.2%
|
0.0%
|
0.0%
|
Pilibhit
|
71.3%
|
24.1%
|
4.2%
|
0.2%
|
0.0%
|
0.0%
|
0.0%
|
Ghaziabad
|
72.9%
|
25.3%
|
0.5%
|
0.4%
|
0.4%
|
0.1%
|
0.0%
|
Bulandshahr
|
77.4%
|
22.2%
|
0.1%
|
0.1%
|
0.0%
|
0.0%
|
0.0%
|
Budaun
|
77.9%
|
21.5%
|
0.0%
|
0.2%
|
0.0%
|
0.1%
|
0.0%
|
Aligarh
|
79.0%
|
19.9%
|
0.2%
|
0.2%
|
0.1%
|
0.1%
|
0.0%
|
Shahjahanpur
|
80.2%
|
17.5%
|
1.7%
|
0.2%
|
0.0%
|
0.1%
|
0.0%
|
Kasganj
|
84.3%
|
14.9%
|
0.2%
|
0.1%
|
0.0%
|
0.3%
|
0.0%
|
Gautam Buddha Nagar
|
84.6%
|
13.1%
|
0.6%
|
0.4%
|
0.3%
|
0.1%
|
0.0%
|
Firozabad
|
85.7%
|
12.6%
|
0.1%
|
0.1%
|
0.8%
|
0.1%
|
0.0%
|
Agra
|
88.8%
|
9.3%
|
0.3%
|
0.2%
|
0.5%
|
0.1%
|
0.0%
|
Hathras
|
89.3%
|
10.2%
|
0.0%
|
0.1%
|
0.1%
|
0.0%
|
0.0%
|
Mathura
|
90.7%
|
8.5%
|
0.1%
|
0.1%
|
0.1%
|
0.0%
|
0.0%
|
Etah
|
90.8%
|
8.2%
|
0.0%
|
0.1%
|
0.3%
|
0.2%
|
0.0%
|
Mainpuri
|
93.5%
|
5.4%
|
0.0%
|
0.1%
|
0.2%
|
0.5%
|
0.0%
|
I have sorted the districts according to the the proportion of Hindus in the population and categorized the districts into three groups - where Hindus make up 70% or less of the population, where Hindus make up 70% to 85% of the population, and where Hindus make up more than 85% of the population.

This choice of the population limits for this categorization is entirely arbitrary, and is based on intuition more than anything else. It is my belief that the honourable Member of Parliament's focus is largely on the districts that are highlighted in Yellow. It is therefore based on this belief that the rest of my analysis will be limited to only these nine districts.
District Rampur


In the above two graphs, one can observe that
- The proportion of populations between Hindus and Muslims is fairly constant across the age groups. This indicates that the birth rates for both groups is probably equal.
- The population pyramid for Hindus and Muslims are fairly identical - not just in shape, but even in size (in fact, they appear as mirror images in the graph above). This indicates that the both populations are in the similar growth stage, with high birth rates and high death rates (lower life expectancy).
Demogaphic shift: Unlikely.
District Moradabad
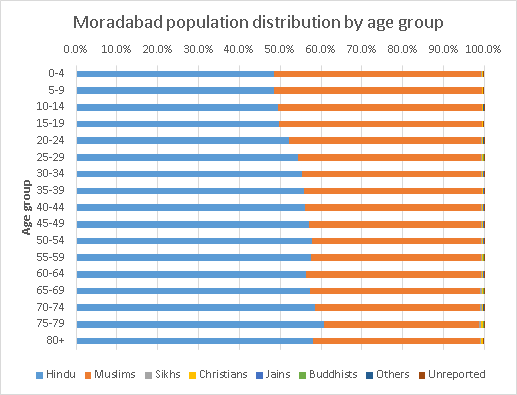

In the above two graphs, one can observe that
- The proportion of populations between Hindus is higher at higher age groups, but becomes progressively decreases in lower age groups. This indicates that Muslims have higher birth rates than Hindus.
- The population pyramid for Hindus and Muslims are fairly identical - not just in shape, but even in size. This indicates that the both populations are in the same growth stage, with high birth rates and high death rates (lower life expectancy). However, the Muslim population is at a slightly higher growth trajectory with a marginally broader base.
- However, since the birth rates of Muslims are higher, it is likely that their population will likely grow at a marginally higher rate than that of the Hindus and will make up a higher proportion of the population as the younger population grows old. In fact, proportion of Hindus can fall under 50% within the next 40 years.
Demogaphic shift: Likely.
District Bijnor


The graphs for Bijnor are very similar to those of Moradabad. Not just we see a higher birth rate for Muslims, the population pyramids are also identical, albeit with a marginally higher growth for Muslims, leading to the conclusion that the proportion of Hindus in the population will likely gradually fall and may drop below 50% over the next four decades.
Demographic shift: Likely.
District Saharanpur


Saharanpur presents an interesting case.
- The proportion of Muslims is around 30-35% in the higher age groups, but increases substantially to 50% in the lower age groups. This would not have had a big impact on the demographics of the district if the higher birth rates were compensated by higher death rates, while the Hindus with lower birth rates had correspondingly lower death rates.
- However, the population pyramid indicates no such favourable position for the Hindus (perhaps only a marginal lower death rate). The pyramids for both communities is triangular and broad-based indicating higher birth rates and higher death rates (narrower tips in the graphs). But the size of the base of pyramid of Muslims is much wider than that of the Hindus indicating a higher growth rate.
- This is a strong indication of a demographic shift in the balance of the Muslims in the district with Hindus likely to fall under 50% in perhaps the next four decades.
Demographic shift: Highly likely.
District Muzaffarnagar


The graphs for Muzaffarnagar is very similar to those of Saharanpur.
- Muslims show much higher birth rates than the Hindus indicated by their higher proportions in lower age groups (nearly 50%) while in the higher age groups making up only 30% of the population.
- The population pyramid for the Muslims has a much wider base than that of the Hindus even though both communities show a broad-based triangular pyramid structure. While the Hindus perhaps enjoy a marginally higher life expectancy than the Muslims, as observed in the marginally wider bars near the top, the difference is not significant enough to compensate for the disadvantage they have owing to lower birth rates than the Muslims as observed in the far wider base for the Muslims in the pyramid.
- At the current rate, there is a strong indication of Hindus falling below 50% of the population within the next three and a half decades.
Demographic shift: Highly likely.
District Amroha


The case of Amroha is similar to that of Moradabad and Bijnor.
- There is a positive indication of a higher birth rate among Muslims whose proportion increases in the population as one goes from higher age groups to lower age groups.
- However, the population pyramids for both the communities are identical in shape and size indicating similar growth stage of the populations. While the tips of the pyramids are nearly balanced, the base of the pyramids show a slight variance in favour of the Muslims indicating a marginally higher growth for them.
- It is unlikely that Hindus will see their numbers drop to less than 50% in the next century.
Demographic shift: Less likely.
District Meerut


The above graphs clearly show a substantial skew towards the growth rate of Muslims.
- While the Muslims make up less than 30% of the population in higher age groups, their share is nearly 45% in the lower age groups. It clearly indicates a much higher birth rate among Muslims.
- The population pyramid, on the other hand, also indicates that the population of Hindus is now slowly moving away from high growth stage to a stabilizing stage (decreasing birth rates and increasing life expectancy) as evident in a slight bulge appearing in the middle ages.
- It is not clear how much of the high birth rate of the Muslims is offset by their seemingly higher death rates, but the proportion of Hindu population is unlikely to fall dramatically in the coming few decades owing to decreasing death rates. However, the average age of the Hindu population is likely to be higher than that of the Muslim population.
Demographic shift: Less likely.
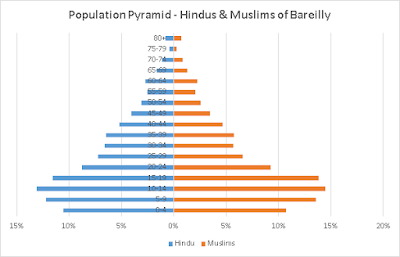
District Bareilly


The district of Bareilly is quite similar to the district of Rampur in that not only the proportion of Hindus and Muslims is fairly consistent across all age groups, the population pyramid also show similar growth stage for both populations, i.e. high birth rates and high death rates.
Therefore, it is unlikely that the proportion of Hindu population will fall any time soon in this district.
Demographic shift: Unlikely.
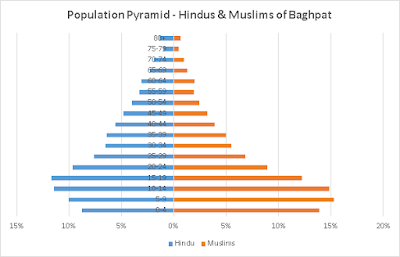
District Baghpat


The following observations can be made about the district of Baghpat.
- This is by far the most astonishing graph so far. The proportion of Muslims in the higher age groups is less than 20%, but as we move to lower age groups, their share dramatically increases to nearly 40% of the population! This clearly indicates a vast difference in birth rates between Hindus and Muslims.
- While birth rates of Muslims is much higher as evidenced by the broader base of their side of the pyramid, the Hindu population is slightly wider at the middle and at the tip indicating higher life expectancy.
- It is not clear how much is the higher birth rates of Muslims is offset by the higher death rates, but the evidence of the graph seems to suggest that the unusually higher birth rates may have a larger bearing on the demographic trends in the future.
Demographic shift: Highly likely.
So, let us summarize what we have determined so far.
District
|
Proportion of Hindus
|
Likelihood of a
demographic shift
|
Rampur
|
46.00%
|
Unlikely
|
Moradabad
|
52.10%
|
Likely
|
Bijnor
|
55.20%
|
Likely
|
Saharanpur
|
56.70%
|
Highly likely
|
Muzaffarnagar
|
57.50%
|
Highly likely
|
Amroha
|
58.40%
|
Less likely
|
Meerut
|
63.40%
|
Less likely
|
Bareilly
|
63.60%
|
Unlikely
|
Baghpat
|
70.40%
|
Highly likely
|
It seems that a demographic shift is likely or highly likely in five out of nine districts that have a significant share of Muslims.

To conclude, the honourable Member of Parliament's assertion of a demographic shift seems to be valid in at least five districts of Western Uttar Pradesh out of 23 districts (as in 2011; there are 27 districts in Western UP as of today).
I reiterate that this in no way can be construed as a reason to feel 'safe' or 'unsafe' as safety can be determined by factors that are outside the scope this analysis. This exercise is only meant to assess whether a demographic shift is likely in Western Uttar Pradesh districts in the years to come.
It may be worth noting, however, that the incidents of Jat-Muslim riots of 2014 and recent reported exodus of Hindu families in Kairana happened in these districts.
Bharat Mata ki Jai.
ps: I welcome suggestions to improve the accuracy of this analysis. Please feel free to suggest them in the comments.